Regression Questions and overview
- Define and explain linear regression:
It is a simpler statistical method to model the relationship between a dependent variable(y) and one or more independent variables(x). It assumes a linear relationship between the variables hence the name linear regression. The word ‘regression’ signifies the tendency of the predicted values to move back towards the average as more data points are incorporated into the model. This is because the model aims to find the best-fitting line that minimizes the overall error, and this line often lies close to the average value of the dependent variable.
2. Define and explain logistic regression
Another statistical method to model the relationship between a binary dependent variable (y) and one or more independent variables (x). What makes it different from linear regression is that it uses the logistic function(f(x) = 1 / (1 + e^(-x))) to predict probabilities, allowing the model to output values between 0 and 1. This makes logistic regression particularly suited for classification tasks, where outcomes are categorical.
3. How are they similar and how are they different?
Similarities: They are both types of regression models that are able to model the relationship between dependent and independent variables, showing how changes in predictors affect outcomes. They are both supervised ML algorithms because because they use labeled data to learn the relationship between input features and the target variable. They both try to minimize error by maximizing fit quality..etc.
Differences: Linear regression predicts a continuous outcome, while logistic regression predicts a binary outcome. In addition, linear regression assumes a linear relationship between variables, whereas logistic regression assumes a non-linear relationship to predict probabilities. They also use different error minimization techniques: linear regression minimizes the sum of squared differences between predictions and actual values, while logistic regression maximizes the likelihood that the model’s predictions match the observed data, using a method called maximum likelihood estimation.
4. Does logistic regression use the Sigmoid function? Explain.
Yes. Logistic regression does create a sigmoid function the typical s shaped curve that has formula :
*f(x) = 1 / (1 + e^(-x)) with y-intercept of 0.5 and horizontal asymptotes of y=0 and y=1.
5. Explain how maximum likelihood is connected to logistic regression
Maximum likelihood is like the least squares method in linear regression. It essentially asks, “What model parameters maximize the probability of observing the actual data given the model?” Instead of minimizing errors like in linear regression, maximum likelihood focuses on finding the parameters that make the observed data most probable under the logistic model.
Data Used for Training and Testing in Logistic Regression and Naïve Bayes Classification

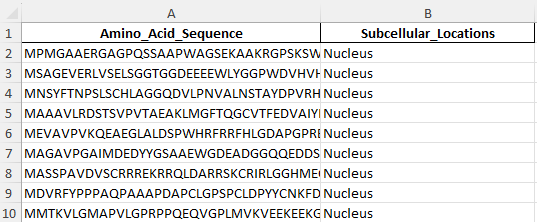
Screenshot of the nuclear protein amino acid sequence train dataset

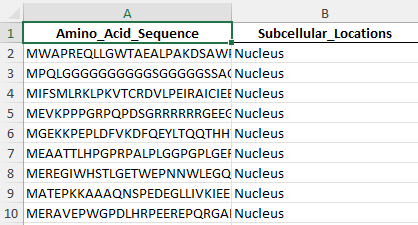
Screenshot of the nuclear protein amino acid sequence test dataset
Python Code for Training and Testing Logistic Regression and Naïve Bayes on Protein Localization Data (Nucleus vs Cytoplasm)
import pandas as pd
from sklearn.model_selection import train_test_split
from sklearn.preprocessing import LabelEncoder
from sklearn.linear_model import LogisticRegression
from sklearn.naive_bayes import MultinomialNB
from sklearn.metrics import accuracy_score, confusion_matrix
from sklearn.feature_extraction.text import TfidfVectorizer

## Loading and filtering data for Nucleus and Cytoplasm
file_path = r"path_to_Exclusive_Location_ProteinsV1.xlsx"
data = pd.read_excel(file_path)
data = data[data['Subcellular_Locations'].isin(['Nucleus', 'Cytoplasm'])]

## Converting location names to numeric codes
label_encoder = LabelEncoder()
data['Location_Code'] = label_encoder.fit_transform(data['Subcellular_Locations'])

## Setting up features and labels
X = data['Amino_Acid_Sequence']
y = data['Location_Code']

## Splitting data into training and testing sets
X_train, X_test, y_train, y_test = train_test_split(X, y, test_size=0.2, random_state=42, stratify=y)

## Using TF-IDF vectorization to create 3-mer features from sequences
vectorizer = TfidfVectorizer(analyzer='char', ngram_range=(3, 3))
X_train_features = vectorizer.fit_transform(X_train)
X_test_features = vectorizer.transform(X_test)

## Training and testing the Logistic Regression model
log_reg_model = LogisticRegression()
log_reg_model.fit(X_train_features, y_train)
y_pred_log_reg = log_reg_model.predict(X_test_features)
log_reg_accuracy = accuracy_score(y_test, y_pred_log_reg)
log_reg_conf_matrix = confusion_matrix(y_test, y_pred_log_reg)

## Training and testing the Multinomial Naive Bayes model
nb_model = MultinomialNB()
nb_model.fit(X_train_features, y_train)
y_pred_nb = nb_model.predict(X_test_features)
nb_accuracy = accuracy_score(y_test, y_pred_nb)
nb_conf_matrix = confusion_matrix(y_test, y_pred_nb)

## Printing accuracy and confusion matrices for both models
print(f"Logistic Regression Accuracy: {log_reg_accuracy:.3f}")
print("Logistic Regression Confusion Matrix:")
print(log_reg_conf_matrix)

print(f"Naïve Bayes Accuracy: {nb_accuracy:.3f}")
print("Naïve Bayes Confusion Matrix:")
print(nb_conf_matrix)
Reggression results and conclusions

Result and conclusion
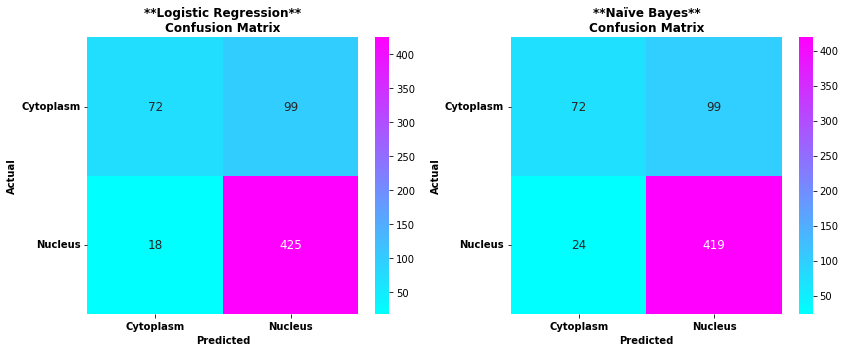
From the confusion matrix above you can see the actual and predicted proteins in both logisitc regression and naive bayes
From the confusion matrices above, we can compare the performance of Logistic Regression and Naive Bayes models in protein localization prediction:
Logistic Regression results:
- True Cytoplasm: 72 correctly predicted as cytoplasm, 99 incorrectly predicted as nucleus
- True Nucleus: 18 incorrectly predicted as cytoplasm, 425 correctly predicted as nucleus
Naive Bayes results:
- True Cytoplasm: 72 correctly predicted as cytoplasm, 99 incorrectly predicted as nucleus
- True Nucleus: 24 incorrectly predicted as cytoplasm, 419 correctly predicted as nucleus
——————————————————————————————————————–
Nuclear Protein Accuracy:
- Logistic Regression: 95.9%
- Naïve Bayes: 94.6%
Cytoplasmic Protein Accuracy:
- Logistic Regression: 42.1%
- Naïve Bayes: 42.1%
Logistic Regression and Naïve Bayes models demonstrated strong performance in predicting nuclear protein localization, with Logistic Regression achieving a slightly higher accuracy of 95.9% compared to Naïve Bayes’ 94.6%. However, both models struggled with cytoplasmic protein prediction, with a significantly lower accuracy of 42.1% for both.
Why is the accuracy low in cytoplasmic protein prediction but higher for nucleus? The discrepancy suggests that nuclear proteins probably have more distinctive sequence patterns or features that make them easier to identify, while cytoplasmic proteins may have more diverse or subtle characteristics that current machine learning approaches struggle to capture effectively. This makes sense considering that the cytoplasm is very complex. However, it should still be possible to achieve higher prediction accuracy with more complex algorithms.
